Week 5 – PROC and ROLL/Clustering

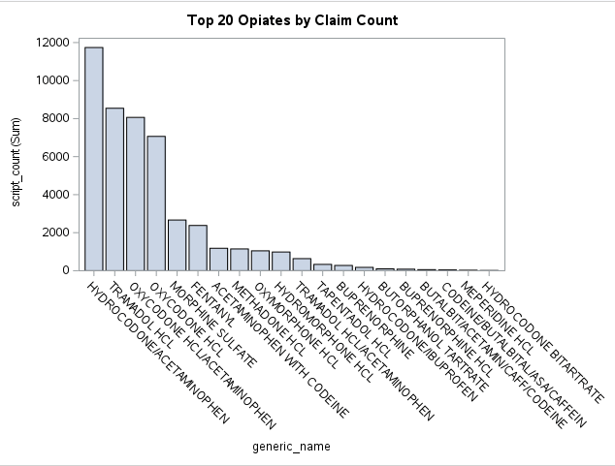
This week was a welcome refresher of the basics in SAS, like PROC MEANS, PROC FREQ, and PROC SQPLOT, and an introduction to clustering and standardization. After last week’s work with MACROS, it was nice to focus on some of the basics that we have learned and then add a new skill to our repertoire (using an NC OPIOID dataset that we constructed last week).

I was a bit overwhelmed last week, and I definitely have some work to do to sharpen my skills with MACROS. This week improved my confidence. Our assignments are gradually providing us with less helper/starter code to assist us and moving towards just telling us what we need to accomplish in each task/step. I think that I am more ready for this than I realized. I worked through the assignment pretty well. After each task, I ran the code and corrected any errors that arose in formatting (looking them up on Google if I needed some assistance confirming what was necessary).

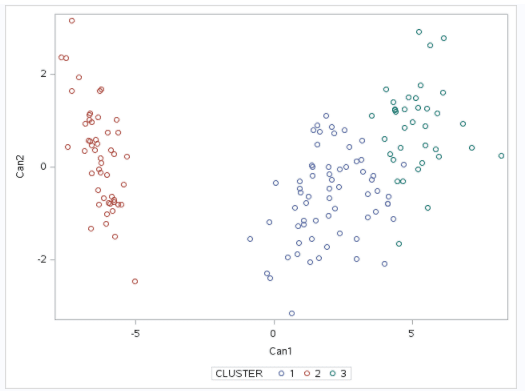
This week the main focus was clustering and standardization. Standardization must occur first, as it allows us to compare data on different scales. It can also be called normalization or scaling. Basically, it takes the data on different scales and standardizes the data into a normalized scale. After this, we can cluster, grouping objects into classes of similar objects. Lastly, we have to un-standardize the data again to evaluate it.

I really enjoyed this week and honing in on this new skill!

Week 4 – Macros and Opioid Analysis

We continued our Opioid Analysis this week. I have found this dataset particularly interesting for two main reasons. First, I live in North Carolina, and so this dataset reflects information from my current location. Second, my fiancé is a first responder, and he sees these drug problems first hand.

I am starting to feel more and more comfortable with SAS, particularly with its basic functions. This week, we will tackle a whole new task with MACROS. I have gone through and done the homework. I just have to go back through and correct my errors. I will say that this homework assignment was definitely more challenging than the preceding ones. I recall Mike telling us that many people can work in SAS, but many do not know how to do MACROS. I think that this makes MACROS an exciting challenge.

I look forward to becoming more comfortable and familiar with how MACROS work. I can definitely see that they make the work easier and more automated. In this assignment, we used them to generate information on our character and numeric variables.

Week 3 – Wrangling Data with SQL

Coding has definitely been a challenge for me, but I have become more comfortable as I have gained more exposure. I fully understand how to set up a library, import the data, and start the first steps to manage the data. I have also been able to correct some of my own errors in SAS before asking for additional help. As the weeks go by, I hope that my confidence in SAS only grows, and that as a result, I become more independent in the software.

SAS is truly remarkable in how it can manage and transform data into tables and graphs that we can then analyze. The first two assignments have been very fascinating, and the assignment for this week will be no exception. This week we will look at the Opioid Epidemic.

The data is focused to North Carolina, so that we can hone in on the data. However, there is still a lot to look at here. I also want to note that North Carolina was ranked tenth in number of opiate related deaths in 2015. This project will utilize SQL, a programming language that is designed to manage data. I am eager to become familiar with this, and in turn gain a new set of skills. This assignment will examine the top 20 opiates by claim amount, the top 10 cities by days supply, and a number of variables relating to the prescribing physicians (i.e. physician opiate ratio, gender of physician, etc.), among many others.

I think that this type of assignment is so interesting to me, because its application to the real world is so important. Indeed, this data would be helpful in determining whether some physicians need to cut back on their prescription of opiates and in figuring out the cities that need to deploy teams to manage and alleviate this problem.

Picture: Graph from Week 3 Assignment – showing top 20 opiates by claim amount

Week 2 – Data Wrangling for Portfolio Profits

During this second week of class, we delved a little deeper into SAS – specifically into portfolio profits. We started with the asset classes (i.e. guaranteed, money market, fixed income, real estate, and stocks) and broke them down by risk level/reward. The goal of diversification is to obtain the highest return for the lowest possible risk.

For each asset and portfolio, it is important to know the following statistics – the actual return, average daily return, standard deviation, and the SHARPE ratio ([expected return – risk free rate]/standard deviation). The project for this week will look at several different assets and our portfolio of these assets. We will look at the returns and the correlations to determine the smartest investment decisions.

This type of project really interests me. My Mom passed away a couple of years ago, and she set up a Trust for me that is with a bank and is being invested. I see how these investments are doing all the time, but I have never felt like I have fully understood how the assets and portfolio are doing comparatively speaking. I feel like after doing projects like these, I will know what to look for in order to make sound investment decisions.

Picture: PowerPoint from Week 2

Week 1 – Introduction to SAS

The first class was over before I knew it. It was my first exposure to SAS and coding, so it sort of felt like a foreign language. I know that I will gain a better understanding of the software and how it works, as I apply what Mike went over and spend more time adapting to it. I feel slightly overwhelmed, but I am sure many others do too. I know that if I apply myself and work hard though, I will make it through to the other side of this. I tried to let as much information as possible sink in during class. I definitely learned the importance of a semi-colon (in closing statements) and in making sure to start each statement with DATA or PROC.

When we arrived at the example assignment, it was quite amazing to see the result of the code. I can see how this would be very useful and could be applied to so many business problems. I work in the banking industry (in Financial Crimes) and also am very interested in investing. The work done in SAS definitely could help support investment decisions. I just did a project for my manager, which analyzed our current procedures and derogatory findings. She really liked my level of analysis, but I know after I gain these new tools and insight, that I will be able to do an even more thorough and accurate analysis. While this new tool is slightly daunting, I am facing it with excitement because I know that it can open doors and allow me to perform better.

Photo from Week 1 PowerPoint – Project 1 Assignment Example – Mike Ames

Design a site like this with WordPress.com
Get started